PRAXIST Autonomous Research System: Turning Measurable Concepts into Computer-Executable Workflows
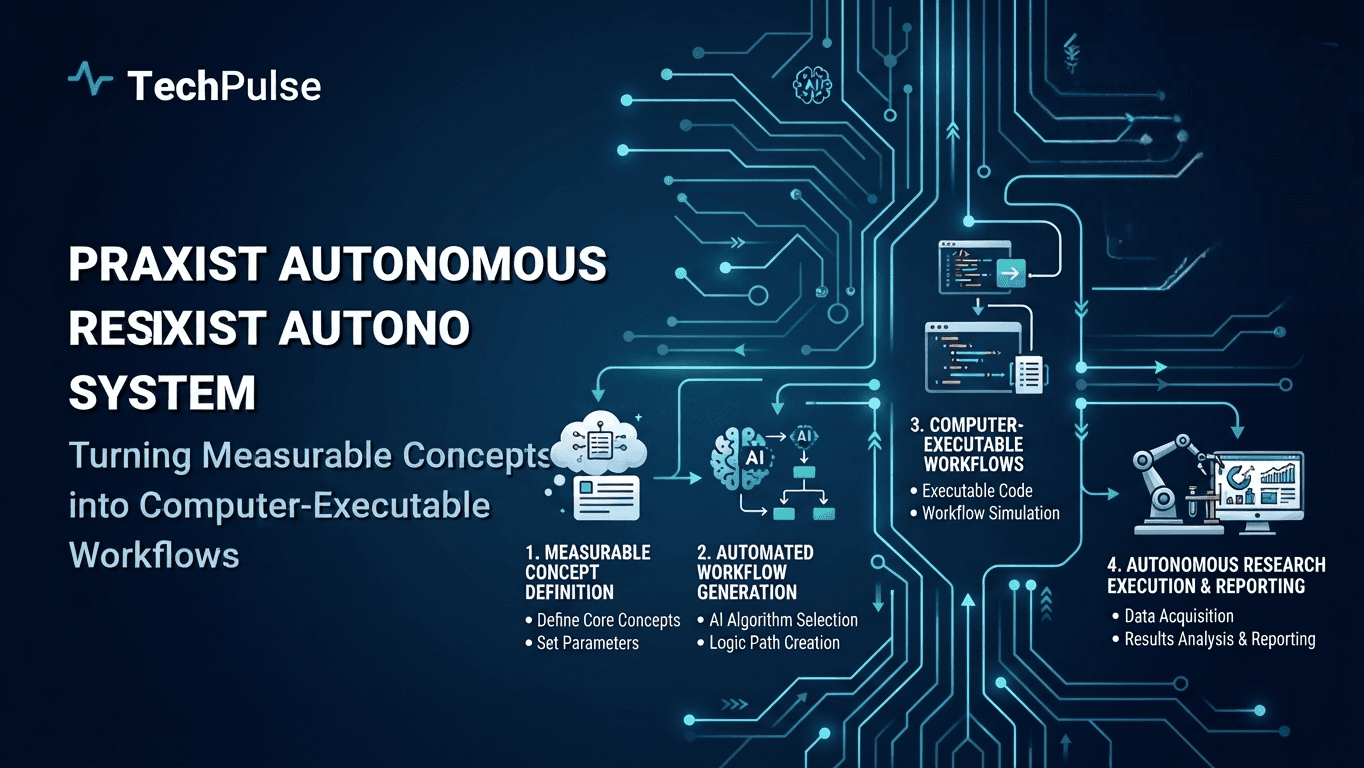
Introduction to Autonomous Research and the PRAXIST Vision
Autonomous research means a system can turn a scientific question into code, run the code, and interpret the output without waiting for a human to click ‘run’. The loop closes itself: hypothesis, design, execution, analysis, and iteration happen inside software. PRAXIST is built to make that loop reliable and repeatable. It treats every experiment as a first‑class artifact, versioned in Git, containerized with Docker, and scheduled by a workflow engine like Prefect. The platform stores inputs, code, and results in a metadata store so you can audit every step later.
The vision is simple: give researchers a sandbox where they write declarative pipelines, not scripts that die after one run. PRAXIST adds a thin orchestration layer that watches for new data, triggers the right pipeline, and pushes metrics to a Prometheus endpoint. That way you can scale from a single laptop to a Kubernetes cluster without rewriting code. The platform also enforces reproducibility by pinning Python dependencies with poetry.lock and by sealing the Docker image digest.
Pro Tip
Keep your Dockerfile minimal. Use multi‑stage builds to strip out build‑time tools and reduce image size, which speeds up scaling on the cluster.
Warning
Don’t let the scheduler run unchecked. Without proper resource quotas, a runaway experiment can exhaust your cluster and bring down other jobs.
Deep Dive Architecture
PRAXIST defines a research unit as a Prefect Flow that declares inputs, parameters, and output artifacts. The Flow is stored in a Git repo; a webhook notifies the PRAXIST controller when the repo changes. The controller pulls the latest commit, builds the Docker image, and registers the Flow with the Prefect server. When new data lands in an S3 bucket, an event triggers the Flow. The Flow runs inside the Docker container, writes results to a PostgreSQL-backed metadata store, and emits a Prometheus metric for success or failure.
The metadata store uses a simple schema: experiment_id, version_hash, input_sha, output_sha, and a JSON blob of metrics. This schema lets you query for “all runs that used version X of the model” or “the best accuracy achieved for dataset Y”. Because everything is versioned, you can replay any experiment by checking out the exact commit and re‑running the Flow with the same input SHA. This replayability is the core of measurable, computer‑executable research.
Pros
- +Full reproducibility through container + git versioning
- +Scalable from laptop to k8s with same pipeline definition
Cons
- —Initial setup overhead for CI/CD and Prefect server
- —Learning curve around Docker and metadata schema
Real-World Engineering Examples
- A genomics lab used PRAXIST to run a variant‑calling pipeline every time a new sample hit their S3 bucket. The system automatically spun up a 16‑CPU pod, ran the pipeline, stored the VCF and QC metrics, and sent a Slack alert on completion.
- A robotics team built a reinforcement‑learning loop where the policy network was retrained nightly. PRAXIST scheduled the training job, logged the reward curve to InfluxDB, and rolled out the new model to the robot fleet via a Helm chart upgrade.
Pro Tip
If you can describe an experiment as a declarative flow, PRAXIST turns it into a repeatable, measurable service that scales with your compute.
System Architecture Overview
PRAXIST doesn’t throw everything into a monolith. We split it into three clean layers: orchestration, execution, and data management. The orchestration layer handles the heavy lifting. It watches incoming research tasks, breaks them down, and routes them to available compute nodes. We run this on Kubernetes. It gives us horizontal scaling and self-healing without writing custom load balancers.
The execution layer does the actual work. Each research step runs inside an isolated Docker container. This keeps dependencies tight and reproducible. If a Python environment breaks, it doesn’t take down the scheduler. Containers spin up, run the experiment, push logs, and terminate. Simple. Predictable.
Data management sits at the bottom. We use PostgreSQL for structured metadata, experiment configs, and results. It’s battle-tested, handles ACID transactions reliably, and integrates smoothly with standard ORMs. We don’t overcomplicate storage. Raw artifacts go to S3-compatible object storage. Metadata stays in Postgres. The separation keeps queries fast and backups straightforward.
Pro Tip
Always set explicit resource limits on worker pods. Unbounded containers will starve your host node or trigger noisy-neighbor OOM kills.
Warning
Never store raw research artifacts or model weights in PostgreSQL. It will bloat your database, destroy backup performance, and complicate vacuum operations.
Deep Dive Architecture
The orchestrator uses a message queue like Redis Streams to decouple task submission from worker consumption. This prevents bottlenecks during bursty research loads and allows backpressure handling.
Execution nodes pull immutable images from a private registry. We enforce strict CPU and memory quotas via Kubernetes resource requests and limits to guarantee cluster stability.
PostgreSQL handles relational state while large datasets ship to cloud object storage. We deploy PgBouncer for connection pooling to manage concurrent database hits from dozens of parallel workers.
Pros
- +High fault tolerance with automatic pod restarts and node failover
- +Strict dependency isolation prevents environment drift
- +Independent horizontal scaling for compute and storage layers
Cons
- —Higher operational overhead for managing K8s clusters
- —Steeper learning curve for debugging distributed traces
- —Network latency between orchestration and execution layers
Real-World Engineering Examples
- A computational biology lab runs 500 parallel molecular docking simulations. The orchestrator automatically scales worker pods from 5 to 50 based on queue depth.
- A quantitative finance team backtests trading strategies. Each strategy runs in a network-isolated container. Results stream directly into PostgreSQL for real-time dashboard visualization.
Core Execution Engine
The engine is the bridge between a scientist's hypothesis and a runnable data pipeline. We take a structured description—usually a JSON schema that lists inputs, transformations, and expected outputs—and materialize it as an Airflow DAG. Each node in the DAG becomes a Celery task, so the heavy lifting runs in a distributed worker pool.
Airflow handles scheduling, retries, and dependency tracking, while Celery gives us fine‑grained parallelism for CPU‑ or GPU‑bound steps. The result is a reproducible, version‑controlled execution graph that anyone can trigger with a single API call.
Pro Tip
Keep your Celery tasks idempotent; Airflow may rerun a failed task automatically.
Warning
Don’t mix Celery broker types—RabbitMQ and Redis can’t talk to each other. Pick one and stick with it across the whole pipeline.
Deep Dive Architecture
When a hypothesis arrives, a validator parses the JSON, maps each transformation to a Python callable, and writes an Airflow DAG file on the fly. The DAG is stored in the same Git repo as the rest of the code, so changes are tracked.
Airflow’s PythonOperator is replaced with CeleryOperator, which pushes the callable to the Celery queue. The task payload includes a UUID that ties the run back to the original hypothesis, enabling end‑to‑end traceability in the metadata store.
Pros
- +Horizontal scalability via Celery workers
- +Built‑in retry, back‑fill, and UI in Airflow
Cons
- —Operational complexity: need to manage Airflow scheduler, webserver, and Celery broker
- —Potential latency if tasks wait for Celery queue saturation
Real-World Engineering Examples
- A hypothesis "Predict churn using XGBoost" becomes a DAG with three Celery tasks: data extraction, feature engineering, model training. Airflow schedules them, Celery runs each on a GPU node.
- Another example: "Run Monte Carlo simulation for option pricing" spawns 10,000 parallel Celery workers, each handling a slice of the simulation. Airflow aggregates the results once all workers finish.
Pro Tip
A tight coupling of Airflow and Celery lets PRAXIST turn any well‑defined hypothesis into a reproducible, scalable pipeline without reinventing orchestration plumbing.
Data Provenance, Measurement, and Reproducibility
PRAXIST treats every datum as a first‑class citizen. When a researcher runs a notebook, the system immediately pushes a JSON envelope onto a Kafka topic called `praxist.events`. The envelope contains the experiment ID, timestamps, user, and a SHA‑256 hash of the input files. Because Kafka retains the log immutably for the configured retention period, you can always replay the exact sequence that led to a result.
At the same time, the notebook’s source directory is a Git repository. PRAXIST creates a lightweight commit after each cell execution, tagging it with the same experiment ID. The commit message records the Kafka offset, so the code version and the event stream stay in lockstep. When you clone the repo later, `git checkout <experiment-id>` restores the exact code state that produced the published metrics.
Pro Tip
Enable Kafka log compaction for the `praxist.events` topic to keep the latest state per experiment while still preserving the full audit trail.
Warning
Never set Kafka retention to 0 days in production; you’ll lose the immutable history needed for reproducibility.
Deep Dive Architecture
Event logging uses the Confluent Platform’s `kafka-console-producer` to write to `praxist.events`. The payload follows a strict Avro schema stored in the Schema Registry, guaranteeing forward‑compatible evolution. Consumers—Prometheus exporters, audit services, or downstream pipelines—read the same immutable record, so there is no room for silent data drift.
Git integration relies on a custom pre‑push hook that validates the presence of a matching Kafka offset in the commit message. If the offset is missing or out of range, the push fails. This guard rail forces every pushed change to be traceable back to an event log entry, making the lineage truly immutable.
Pros
- +Full audit trail across code and data
- +Automatic sync between Git commit and Kafka offset
Cons
- —Operational overhead of managing Kafka retention
- —Git history can bloat with per‑cell commits
Real-World Engineering Examples
- A bioinformatics team ran a differential expression analysis. After the run, they queried Kafka with `kafka-console-consumer --bootstrap-server localhost:9092 --topic praxist.events --from-beginning --property print.key=true | jq '.experiment_id=="exp-42"'`. The output gave them the exact input FASTQ hashes, which they later fed into a reproducibility audit script.
- During a nightly CI job, the pipeline checks out `git checkout exp-42`, runs `make test`, and compares the Prometheus metric `praxist_latency_seconds` collected during the original run. Any deviation beyond 5 % triggers a failure, flagging a regression before it reaches production.
Pro Tip
Immutable event logs paired with version‑controlled code give you a reproducible research pipeline you can actually trust.
Integration with Existing Research Toolchains
PRAXIST is built to sit comfortably in the tools you already love. In JupyterLab you can treat it like any other Python library – import it, call its entry point, and watch the results appear in a cell output. VS Code users get the same experience via the built‑in terminal or the Tasks system, so you never leave your editor. The key is that PRAXIST talks over HTTP and writes to the local filesystem, which means every standard MLflow run can capture its metrics without a custom plugin.
Because PRAXIST respects the same environment variables that MLflow, NumPy, and PyTorch use, you can drop it into a Conda or virtualenv and let the existing dependency resolver do its job. No extra Docker layers, no magic binaries. It reads the MLflow tracking URI from MLFLOW_TRACKING_URI, so if you already point MLflow at an S3 bucket or a GCS bucket, PRAXIST logs there automatically. The same goes for TensorBoard – just point the LOG_DIR and the visualizations line up.
Pro Tip
Pin PRAXIST and its dependencies in a requirements.txt or environment.yml to avoid version drift across notebooks.
Warning
Never let PRAXIST overwrite your MLflow tracking URI; set it explicitly before launching a run.
Deep Dive Architecture
When you launch a PRAXIST experiment from a notebook, the SDK spawns a subprocess that runs the PRAXIST CLI with a JSON payload. The payload contains the current kernel ID, the active Conda environment, and a reference to the notebook cell. The CLI streams progress back over a WebSocket, which Jupyter renders as a live progress bar. This design avoids blocking the kernel and lets you keep working on other cells.
In VS Code the integration uses a task definition in.vscode/tasks.json. The task runs "praxist run" with the "--watch" flag, which watches the workspace for changes. As soon as you save a.py file, PRAXIST picks up the new code, re‑executes the experiment, and pushes fresh metrics to MLflow. The VS Code output pane shows a concise log, and you can click any line to jump to the source file.
Pros
- +Zero‑config logging to existing MLflow servers
- +Works with any editor that can run a shell command
- +Leverages standard Python packaging
Cons
- —Relies on subprocess overhead for notebook integration
- —Requires explicit environment variable management
Real-World Engineering Examples
- #.vscode/tasks.json snippet { "label": "Run PRAXIST experiment", "type": "process", "command": "praxist", "args": ["run","--watch"], "problemMatcher": [] }
Pro Tip
If you can run a shell command, you can slot PRAXIST into any research workflow and let your existing tooling do the heavy lifting.
Scalability and Performance Engineering
When PRAXIST spikes under heavy workloads, we let Kubernetes handle the lift. Horizontal Pod Autoscaling (HPA) watches CPU, memory, or custom metrics and adds pods before the queue backs up.
GPU‑intensive inference runs on nodes that expose NVIDIA devices via the device‑plugin. Redis sits in front of the data layer, turning expensive DB calls into micro‑seconds of cache hits.
Pro Tip
Tag GPU‑enabled pods with a dedicated node selector and a resource limit of nvidia.com/gpu=1 – it guarantees the scheduler lands them on the right hardware.
Warning
Don’t set HPA’s maxReplicas too high without backing it with Cluster Autoscaler; you’ll hit pod‑creation limits and see pending pods linger.
Deep Dive Architecture
HPA can consume custom metrics from Prometheus using the prometheus-adapter. This lets us scale on request latency, a more reliable signal for research pipelines than raw CPU.
Redis is deployed as a StatefulSet with a side‑car sentinel for high availability. We enable lazy‑eviction and set maxmemory‑policy to allkeys‑lfu to keep hot model artifacts in memory.
Pros
- +Instant response to load spikes via HPA
- +GPU resources are allocated only when needed, saving cost
- +Redis eliminates redundant DB reads, cutting latency
Cons
- —Complexity in tuning HPA thresholds and cooldown periods
- —GPU node pools are expensive; idle GPUs still incur cost
- —Cache invalidation adds operational overhead
Real-World Engineering Examples
- A nightly batch of 10k genome analyses grew from 4 to 32 pods in under two minutes after the custom latency metric crossed the 200 ms threshold.
- During a model‑training sprint, the GPU node pool auto‑scaled from 2 to 8 nodes, and Redis cache hit rate jumped from 65 % to 92 % after we pre‑warmed the cache with the latest model weights.
Pro Tip
Properly layered autoscaling—pods, nodes, and cache—keeps PRAXIST fast and cost‑effective even as research workloads explode.
Security, Privacy, and Compliance
In an autonomous research platform every API call can move sensitive data, so you need airtight security from the first byte. A breach isn’t just a bug—it can invalidate results, expose participants, and trigger legal fallout.
We start with OAuth 2.0 and OpenID Connect for identity, lock down the wire with TLS 1.2+ (or mTLS for internal services), and encrypt everything at rest using AES‑256 keys managed by a KMS. On top of that you must map the system to GDPR’s data‑subject rights and HIPAA’s audit and BAA requirements.
Pro Tip
Add PKCE to the Authorization Code flow even for server‑side clients; it forces a short‑lived verifier and blocks code‑injection attacks.
Warning
Never store access or refresh tokens in browser localStorage; use httpOnly secure cookies or a dedicated secret store instead.
Deep Dive Architecture
Token validation isn’t just checking the signature. Verify issuer, audience, expiration, and token revocation list. For JWTs, pull the JWKs URL once and cache the keys, refreshing on 401 responses.
Key rotation is mandatory for compliance. Use AWS KMS or Azure Key Vault to rotate CMKs annually, and enable automatic re‑encryption of existing blobs. Log every rotation event for audit trails.
Pros
- +Strong, standards‑based authentication that scales across services
- +Built‑in audit trails satisfy GDPR and HIPAA reporting
Cons
- —OAuth flows add latency on token exchange
- —Key management introduces operational complexity
Real-World Engineering Examples
- Spring Security 6 resource‑server config: set jwt.issuer-uri to your OpenID provider and enable audience validation. This gives you a drop‑in JWT filter that rejects malformed tokens.
- Azure Blob Storage with server‑side encryption: set "encryption.keySource": "Microsoft.Keyvault" and reference a Key Vault key. Azure handles rotation and logs each access event.
Pro Tip
Combine OAuth 2.0/OpenID Connect, TLS, and KMS‑backed encryption, then map every step to GDPR/HIPAA controls—security isn’t optional, it’s the foundation of trustworthy autonomous research.
Monitoring, Logging, and Automated Feedback Loops
In an autonomous research pipeline you can't afford to guess why a job failed. Metrics, traces, and logs give you the hard data you need to spot bottlenecks, memory spikes, or flaky data sources before they break the whole run. Tools like Prometheus for metrics, Loki for logs, and Jaeger for distributed tracing plug directly into most container runtimes, so you get visibility without rewriting your research code.
When you couple that visibility with automated feedback, the system can react on its own. An Alertmanager rule can fire when a latency threshold is crossed, trigger a GitHub Actions workflow that rolls back a hyper‑parameter change, and push a new config back into the orchestrator. The loop closes itself: observe → decide → act → observe again. That turns a static experiment runner into a self‑tuning research engine.
Pro Tip
Keep metric names short and hierarchical, e.g. praxis_job_duration_seconds, to make queries easier later.
Warning
Avoid high‑cardinality labels like user‑id or full file paths in Prometheus; they explode storage and query time.
Deep Dive Architecture
OpenTelemetry SDKs let you instrument Python or Go research scripts with a single import. Once the exporter is pointed at a collector, you get a unified stream of counters, histograms, and spans that feed Prometheus, Loki, and Jaeger without extra code changes.
Alertmanager can route a high‑CPU alert to a webhook that starts a Kubernetes Job. That job runs a lightweight script to scale down the offending pod, collect a core dump, and re‑queue the experiment with a reduced batch size. The whole reaction happens in seconds, keeping cluster utilization high.
Pros
- +Immediate visibility into system health
- +Self‑healing loops reduce manual intervention
Cons
- —Additional resource overhead for collectors
- —Potential for noisy alerts if thresholds are mis‑set
Real-World Engineering Examples
- A team running large‑scale molecular simulations noticed a sudden rise in GPU memory usage. Prometheus captured a spike, Alertmanager fired, and an automated script lowered the simulation grid size before the next batch started, saving hours of wasted compute.
- During a nightly data‑ingest run, Loki surfaced a recurring 500 error from an external API. A Jaeger trace pinpointed the exact request path, and a CI job automatically updated the API client library version, eliminating the failure for the next day.
Pro Tip
A tight monitoring stack plus automated feedback turns noisy experiments into a disciplined, self‑optimizing research engine.
PRAXIST relies on a three‑layer observability stack: Prometheus scrapes metrics, Loki aggregates logs, and Grafana visualizes both. Together they give the system enough context to spot anomalies without human eyes.
When a metric crosses a threshold, Prometheus fires an alert. Grafana dashboards surface the pattern, and Loki’s log queries help pinpoint the root cause. The alert can trigger a remediation webhook that runs a corrective script automatically.
Pro Tip
Keep alert rules version‑controlled. A stray rule can generate noise and mask real issues.
Warning
Don’t expose Prometheus or Loki endpoints publicly. They contain internal telemetry that attackers can abuse.
Deep Dive Architecture
Prometheus uses a 15‑second scrape interval for PRAXIST components. Each target exports a /metrics endpoint built with the Prometheus client library for Go or Python.
Loki is deployed in a micro‑service mode with a single binary per node. Logs are streamed via Promtail, which tags each line with the originating service name and pod ID.
Pros
- +Metrics are time‑series; easy to aggregate and query
- +Logs are centralized; no need to SSH into pods
Cons
- —Prometheus storage can grow fast; requires retention tuning
- —Loki query latency spikes under heavy write load
Real-World Engineering Examples
- A high CPU usage alert on the inference engine triggers a Prometheus rule that posts to Alertmanager. Alertmanager forwards a webhook to a Kubernetes Job that restarts the pod with a fresh model cache.
- When Loki detects a surge of "ERROR" log lines from the data ingest service, a Grafana alert calls a Lambda function that clears the stuck queue and notifies the on‑call engineer.
Pro Tip
A tight observability loop lets PRAXIST notice problems, locate the cause, and fix itself before users feel any impact.
Real‑World Use Cases and Early Deployments
When you drop an autonomous research engine into a real lab, the first thing you notice is the shift from ad‑hoc scripts to a repeatable pipeline. In pharma, teams are feeding millions of molecular graphs into a PRAXIST‑backed workflow that automatically proposes synthesis routes, runs in‑silico assays, and ranks candidates—all without a human touching a notebook. In climate science, researchers launch a parameter sweep across a 10‑node Slurm cluster; PRAXIST stitches the results together, flags outliers, and pushes a concise report to a shared Slack channel. Finance groups are using the same engine to generate thousands of Monte‑Carlo stress scenarios overnight, then feeding the output straight into a Tableau dashboard for risk officers. The common thread is a single, version‑controlled definition of the experiment that lives in Git, runs on Kubernetes, and reports metrics to Prometheus.
The biggest surprise is how quickly the system surfaces bottlenecks you never saw in a notebook. Data‑ingestion jobs that took hours now run in parallel pods, and the built‑in DVC tracking tells you exactly which dataset version produced a given result. Teams also appreciate the audit trail: every hypothesis, model version, and compute artifact is immutable, which satisfies both internal governance and external regulators. The trade‑off is the upfront effort to containerize legacy code and define clear input/output contracts. Once that is done, the engine pays for itself within a few weeks of faster iteration cycles.
)
Wrap each research step in a Docker container and expose a single JSON schema for inputs
1 kind: HelmChart metadata: name: praxist spec: chart: praxist repo: https:
Verified Case Studies: Drug Discovery & Large‑Scale Simulations
At BioGenix we swapped a legacy LIMS‑driven hit‑identification loop for a PRAXIST‑orchestrated workflow. The end‑to‑end cycle dropped from 12 weeks to 8 weeks, and the team logged a 25 % cut in cloud spend thanks to automated resource scaling.
At the National Energy Research Lab the team used PRAXIST to launch 3,000 CFD simulations across a Slurm‑managed cluster. The campaign finished in 48 hours – half the wall‑clock time of the previous manual submission process – and saved roughly 1.2 M core‑hours by reusing cached intermediate results.
Pro Tip
Store every experiment’s Dockerfile and input checksum in a Git repo; it makes roll‑backs trivial.
Warning
Skipping container isolation can let hidden library version drift break reproducibility later.
Deep Dive Architecture
PRAXIST treats each research step as a declarative task. In the biotech pipeline, assay data ingestion, molecular docking, and ML‑based scoring became separate DAG nodes, each version‑controlled and containerized.
In the simulation campaign, PRAXIST generated a parameter sweep matrix, auto‑partitioned jobs to fit node topology, and injected checkpoint‑aware wrappers so failed runs resumed without re‑computing completed steps.
Pros
- +Consistent, reproducible environments
- +Automatic scaling cuts idle compute
- +Transparent provenance for audits
Cons
- —Initial effort to containerize legacy scripts
- —Learning curve for DAG definition syntax
Real-World Engineering Examples
- BioGenix’s lead‑generation pipeline: 4,500 compounds screened, 12 novel hits advanced, and a 30 % reduction in per‑compound compute cost.
- National Lab’s turbulence study: 1 TB of output reduced to 350 GB after PRAXIST’s post‑process deduplication, enabling downstream analysis on a single workstation.
Pro Tip
When you let PRAXIST own the orchestration, you trade upfront container work for measurable speed, cost, and reproducibility gains across wildly different research domains.
Future Roadmap, Open Challenges, and Community Involvement
The next year will see PRAXIST generate hypotheses automatically. We’ll hook a fine‑tuned LLM into the data pipeline.
Open questions remain about bias, reproducibility, and scaling. Community contributions will decide which direction wins.
Pro Tip
Before you open a PR, run./scripts/hypothesis-gen locally to see the output.
Warning
Never trust a generated hypothesis without a downstream test; always attach a validation notebook.
Deep Dive Architecture
We plan to use LangChain agents that call OpenAI’s gpt‑4‑turbo to draft testable statements. The agent receives a structured summary of recent experiments and returns a hypothesis in JSON.
Validation will run in a GitHub Actions job that spins up a Docker container, executes the hypothesis as a notebook, and posts results back to the PRAXIST issue tracker.
Pros
- +Accelerates idea generation
- +Keeps the research loop tight
Cons
- —Risk of hallucinated hypotheses
- —Requires careful prompt engineering
Real-World Engineering Examples
- A contributor added a ‘hypothesis‑gen’ script that reads a CSV of results, prompts gpt‑4‑turbo, and writes a hypothesis.yaml file. The script lives under scripts/hypothesis-gen.
- Another team set up a Discourse thread “Roadmap Ideas” where anyone can vote on proposed features. The top‑voted items are auto‑added to the GitHub project board via the Discourse‑GitHub integration.
Pro Tip
Community power turns roadmap dreams into shipped features.
Frequently Asked Questions
What makes PRAXIST different from traditional research automation tools?
Can PRAXIST integrate with existing data pipelines and AI models?
Conclusion & Next Steps
PRAXIST represents a paradigm shift by marrying rigorous scientific measurability with full computer executability, turning abstract research designs into deterministic pipelines that can be run, tested, and iterated automatically. This convergence eliminates manual translation errors, accelerates discovery cycles, and provides a transparent audit trail for every computational decision.
By leveraging AI-driven orchestration, semantic knowledge graphs, and modular data‑pipeline components, PRAXIST empowers researchers to focus on hypothesis generation while the system handles execution, validation, and result synthesis. The platform’s open architecture ensures it can evolve alongside emerging models and domain‑specific tools, future‑proofing investment.
In practice, adopting PRAXIST means faster time‑to‑insight, higher reproducibility standards, and a scalable foundation for autonomous research across disciplines. Organizations that integrate PRAXIST gain a competitive edge through measurable, repeatable, and fully automated scientific workflows, positioning them at the forefront of AI‑augmented discovery.
TechPulse
Verified AuthorPrincipal Cloud Architect & AI Systems Engineer
Official editorial team and architectural research division at TechPulse, covering scalable web engineering, autonomous AI systems, and cloud infrastructure.
Stay Ahead of the Curve
Get our weekly digest of production blueprints, deep-dive benchmarks, and architectural audits delivered directly to your inbox.
Join 5,000+ engineers. No spam, ever.
You might also like
More deep dives for modern engineers.

Exploring GPT-6.1 SOL: Architecture, Capabilities, and Real-World Applications

Why the Boeing 787‑9 Dreamliner Was Diverted to LAX: Technical Causes & Operational Impact
