Creepy Crawlies: How Modern Data Engineering Tames Web Crawlers for Scalable Ingestion
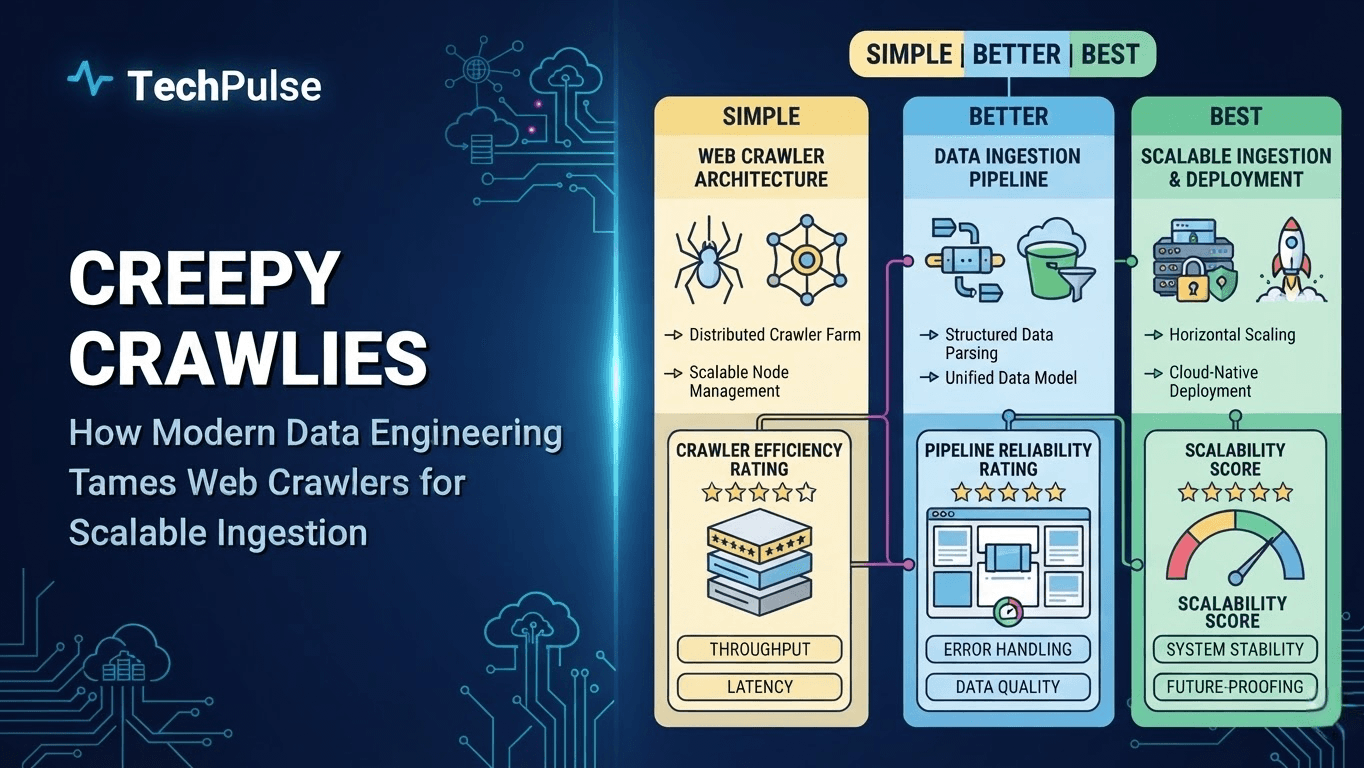
Introduction to Web Crawling in Data Engineering
Web crawling—sometimes jokingly called a "creepy crawlie"—is the automated process of fetching web pages and extracting their content. In a data‑engineer’s toolbox it’s the first step that turns the open web into a structured data source. A crawler follows links, respects robots.txt, and hands raw HTML downstream for parsing. It’s not a fancy AI trick; it’s a disciplined, repeatable job that turns billions of pages into rows you can query.
In modern pipelines the crawler lives at the ingestion layer. It runs on a schedule, pushes raw payloads into a data lake, and lets downstream jobs clean, enrich, and analyze the data. Because the web changes constantly, a well‑tuned crawler gives you fresh signals—price updates, news headlines, sentiment—that keep dashboards relevant. Scaling is just a matter of adding more workers or using a cloud service like AWS Batch or GCP Cloud Run.
Pro Tip
Start with a small seed list and expand gradually. Monitoring crawl depth prevents runaway jobs and saves bandwidth.
Warning
Ignore robots.txt or overload a site and you’ll get blocked, or worse, legal trouble. Always respect crawl rate limits.
Deep Dive Architecture
A typical crawler splits into four parts: Scheduler decides which URLs to fetch next; Downloader retrieves the HTML (often via HTTP libraries like requests or Scrapy’s downloader); Parser extracts the bits you need (XPath, CSS selectors, or regex); Storage writes raw or processed data to S3, GCS, or a database. Each piece can be swapped out, letting you tune performance or compliance independently.
When you embed a crawler in a data pipeline, treat its output as any other raw source. Store the HTML or JSON in a versioned bucket, then trigger an ETL job (Airflow, Dagster, or Prefect) to clean and load into a warehouse. Downstream analytics—SQL, Looker, Power BI—can now treat web‑derived tables like any internal dataset.
Pros
- +Automates massive data collection
- +Provides near‑real‑time signals for analytics
Cons
- —Can be blocked or throttled by target sites
- —Legal and ethical considerations around data ownership
Real-World Engineering Examples
- A news aggregator uses Scrapy to pull RSS feeds and article pages, stores the HTML in an S3 bucket, and runs a Glue job to extract title, author, and publish date. The cleaned table feeds a Tableau dashboard that shows trending topics across regions.
- A price‑watch service runs a lightweight Python script with requests and BeautifulSoup every hour, writes product name, price, and timestamp to a PostgreSQL table, and fires a Lambda function that sends Slack alerts when a price drops more than 10%.
Pro Tip
A well‑engineered crawler turns the chaotic web into a reliable data feed—just respect limits, keep it modular, and let the rest of your pipeline do the heavy lifting.
Fundamental Architecture of a Crawl System
A crawler starts with a seed list. Those URLs feed the scheduler, which decides what to fetch next.
The fetcher pulls pages, hands them to the parser, and the parser extracts links. New links go back to the scheduler, while extracted data lands in storage.
Pro Tip
Keep the seed list in a fast key‑value store like Redis; it makes adding or removing seeds trivial at runtime.
Warning
Don’t let the scheduler hand the same URL to multiple fetchers at once. Duplicate fetches waste bandwidth and can get you blocked.
Deep Dive Architecture
The scheduler is the brain. It maintains a priority queue, respects robots.txt, and throttles per‑host to avoid overload.
The storage layer should be split: raw HTML in an object store (e.g., Amazon S3) and structured data in a searchable index like Elasticsearch.
Pros
- +Modular components can be swapped without touching the whole system
- +Fault isolation makes it easier to scale each piece independently
Cons
- —More moving parts increase operational overhead
- —Cross‑component latency can become a bottleneck if not tuned
Real-World Engineering Examples
- Apache Nutch uses a pluggable fetcher and a Hadoop‑backed storage layer, scaling to billions of pages.
- Scrapy’s architecture mirrors this design: start_requests builds the seed list, the Scheduler queues Requests, the Downloader fetches, and the Item Pipeline stores results.
Pro Tip
A clean separation of seed, scheduling, fetching, parsing, and storage lets you scale each piece independently and keep the crawl healthy.
Open‑Source Crawling Frameworks
Scrapy 2.11, Apache Nutch 2.5, and Heritrix 3.4.0 are the go‑to tools when you need a production‑grade crawler. Each one solves the same problem with a different philosophy, so you have to match the tool to your constraints.
Scrapy leans on Python’s ecosystem, Nutch rides Hadoop, and Heritrix targets archival institutions. Their extensibility, distributed execution model, and community health vary enough to affect long‑term maintenance.
Pro Tip
Lock the framework version in your CI pipeline; minor releases can introduce breaking API changes.
Warning
Don’t assume a plugin written for Scrapy 1.x will compile unchanged on 2.11 – the middleware API was tightened in the 2.x series.
Deep Dive Architecture
Extensibility: Scrapy uses middleware, extensions, and item pipelines that you can drop into settings. Nutch exposes a plugin system (e.g., protocol‑http, parse‑html) that you enable via nutch-site.xml. Heritrix’s modules are Java classes configured in the crawl controller UI, but adding a custom processor requires recompiling the JAR.
Distributed execution: Scrapy itself is single‑process, but the scrapy‑cluster project or Scrapy Cloud adds a Kafka‑based queue for horizontal scaling. Nutch is built on Hadoop MapReduce, so you get out‑of‑the‑box distributed fetch and parse. Heritrix can be sharded manually across machines, but there is no native cluster manager; you orchestrate with scripts or Kubernetes.
Pros
- +Scrapy: rapid development, rich ecosystem of extensions
- +Nutch: proven scalability on Hadoop clusters
- +Heritrix: strong support for WARC output and archival standards
Cons
- —Scrapy: single‑node core requires extra tooling for true distribution
- —Nutch: Java heavyweight, steep learning curve for Hadoop configuration
- —Heritrix: smaller community, fewer modern plugins, manual scaling
Real-World Engineering Examples
- The New York Times data‑team runs a Scrapy 2.11 spider to pull article metadata for their internal recommendation engine, leveraging pipelines for deduplication and storage in PostgreSQL.
- The Internet Archive’s “Common Crawl” pipeline historically used Nutch 2.5 to harvest billions of pages, feeding MapReduce jobs that generate WARC files.
- The British Library’s digital preservation stack still runs Heritrix 3.4.0 to ingest web collections, customizing the crawl controller to respect robots.txt nuances for legal compliance.
Pro Tip
Pick Scrapy for fast Python projects, Nutch when you already run Hadoop at scale, and Heritrix if archival fidelity and WARC output are non‑negotiable.
Distributed Crawl Execution with Apache Beam and Google Cloud Dataflow
Apache Beam 2.55.0 lets you write a crawler once and run it anywhere—DirectRunner for local tests, Dataflow for massive scale. The SDK abstracts away the execution model, so you focus on transforms instead of threading, retries, or sharding. When you submit the pipeline to Dataflow, Google automatically provisions workers, balances load, and recovers from pre‑emptions without you touching any VM settings.
Because Beam is language‑agnostic, the same pipeline can live in Python, Java, or Go. That means teams can pick the language they know best while still getting Dataflow’s autoscaling, exactly‑once semantics, and built‑in monitoring. The model also encourages a clean separation: a source that emits seed URLs, a DoFn that fetches pages, and a sink that writes metadata to BigQuery. This separation keeps the code testable and lets you swap components—swap GCS for Pub/Sub, or BigQuery for Cloud Storage—with a single line change.
Pro Tip
Reuse the same DoFn across runners; it guarantees identical behavior locally and in production.
Warning
Don’t embed heavy libraries like Selenium in a DoFn; they increase container size and startup latency, hurting autoscaling.
Deep Dive Architecture
Beam’s ParDo runs each URL in its own bundle. Dataflow’s autoscaler watches CPU and memory, adding workers when fetch latency spikes. Bundling also gives Beam’s checkpointing a natural place to resume after a worker crash, ensuring no URL is lost.
Fault tolerance comes from Beam’s state and timers. By storing the crawl status in a BagState, you can retry only the failed URLs instead of re‑crawling the entire shard. This pattern scales to petabytes because the state lives in Cloud Dataflow’s durable storage, not in VM memory.
Pros
- +Language‑agnostic SDK, same code runs locally and in the cloud
- +Built‑in autoscaling and exactly‑once guarantees
Cons
- —Cold‑start latency for large worker pools
- —Learning curve around Beam’s model (PCollections, transforms)
Real-World Engineering Examples
- A media company seeded 10 M URLs from Cloud Storage, ran the Beam pipeline on Dataflow, and indexed 1 TB of HTML in under three hours. The job auto‑scaled from 5 to 300 workers and recovered from a transient network outage without manual intervention.
- An e‑commerce site added a custom DoFn that extracts product IDs, writes them to a Pub/Sub topic, and triggers downstream pricing updates—all within the same Beam graph.
Pro Tip
Beam gives you a single, testable codebase that scales from a laptop to a petabyte‑scale Dataflow job, handling retries and autoscaling for free.
Orchestrating Crawl Jobs with Apache Airflow
Airflow 2.8.2 lets you treat a web crawl like any other data pipeline. You define a DAG, plug in three PythonOperators—fetch, parse, and load—and let the scheduler handle execution. The fetch task pulls a URL list from an S3 bucket, then uses requests with a configurable timeout. The parse step runs a BeautifulSoup routine that extracts links and stores the result in an XCom payload. Finally, the load task writes the cleaned records to a PostgreSQL table via SQLAlchemy. All three tasks share a common retry policy: three attempts, exponential back‑off, and a 5‑minute delay between tries. If the fetch fails, downstream tasks are skipped automatically thanks to Airflow’s built‑in trigger rules.
Back‑pressure is handled with pools and concurrency limits. You create a pool called "crawl_pool" with a slot count that matches your target site's rate limit—say 10 slots for a polite crawl. Each fetch operator is assigned to that pool, so Airflow never launches more than ten HTTP calls in parallel. If a downstream task repeatedly fails, you can raise a AirflowFailException to trigger a DAG‑level alert and pause further runs. The DAG also uses a schedule_interval of "0 * * * *" to run hourly, ensuring you stay fresh without overwhelming the source.
Pro Tip
Use the @task decorator for cleaner code and automatic XCom handling.
Warning
Never push large blobs ( > 5 MB ) through XCom; store them in external storage instead.
Deep Dive Architecture
Retries: default_args = {"retries": 3, "retry_delay": timedelta(minutes=5), "retry_exponential_backoff": true}. This gives you three tries with increasing wait times, which is ideal for flaky HTTP endpoints.
Back‑pressure: Define a pool in the UI or CLI (airflow pools set crawl_pool 10 "Rate‑limit for crawls") and reference it in each PythonOperator via pool='crawl_pool'.
Pros
- +Built‑in scheduling, retries, and monitoring
- +Extensible with plugins and custom operators
Cons
- —Heavyweight for tiny one‑off crawls
- —Requires a running Airflow instance and database
Real-World Engineering Examples
- A news aggregator used this pattern to pull RSS feeds every hour, parse headlines, and upsert them into a Redshift warehouse.
- An e‑commerce price tracker limited its fetch concurrency to 5 slots, respecting vendor API quotas while still delivering near‑real‑time updates.
Pro Tip
Airflow gives you a production‑grade scaffold for crawls—retries, rate limiting, and observability—without writing custom orchestration code.
Streaming Ingestion of Crawl Results via Apache Kafka
The crawling process generates a massive amount of data, including raw HTML and metadata. To handle this data efficiently, we use Apache Kafka, a distributed streaming platform known for its high‑throughput and fault‑tolerant data processing capabilities. Kafka acts as a central hub for data ingestion, allowing us to stream crawl results in real time.
Kafka 3.6.0, released in 2024, adds tiered storage, improved quorum handling, and tighter integration with the Confluent Schema Registry. Those upgrades boost throughput and make it easier to retain raw HTML blobs for days without overwhelming brokers. With proper topic partitioning, each crawler instance can write directly to its own partition, keeping latency under a second.
Downstream, Apache Flink 1.18 consumes the Kafka topics, deserializes the HTML payloads, and enriches them with metadata in a stateful stream job. Flink’s event‑time windows and exactly‑once guarantees let us aggregate link graphs, detect duplicate pages, and feed a real‑time index without losing data.
Pro Tip
Enable Kafka's log compaction on the metadata topic to keep only the latest crawl state per URL and reduce storage pressure.
Warning
Never mix schema versions in the same topic; Flink will fail to deserialize mismatched records.
Deep Dive Architecture
Kafka’s fault‑tolerant design ensures that each partition has multiple replicas, so a broker failure never drops a crawl result.
Flink’s checkpointing aligns with Kafka offsets, guaranteeing exactly‑once processing even when jobs are restarted.
Pros
- +High‑throughput ingestion of large HTML blobs
- +Exactly‑once semantics across Kafka and Flink
- +Scalable both horizontally (Kafka partitions) and vertically (Flink task slots)
Cons
- —Managing large message sizes can stress network and broker storage
- —Flink state size grows quickly with full‑page storage; requires careful TTL policies
Real-World Engineering Examples
- A news aggregator streams article HTML from hundreds of crawlers into Kafka, then uses Flink to extract headlines and publish them to a live dashboard.
- A security scanner ingests raw page snapshots via Kafka and runs Flink jobs that flag vulnerable scripts as soon as they appear.
Pro Tip
Pairing Kafka 3.6.0 with Flink 1.18 gives you a low‑latency, fault‑tolerant pipeline that can stream raw HTML and metadata from crawlers straight into real‑time analytics.
Persisting and Indexing Crawled Data
Crawlers spit out raw HTML, images, and JSON blobs faster than you can write them to disk. You need a place that never runs out of space and can survive regional outages. Object storage services like Amazon S3 or Azure Blob fit that bill perfectly.
Once the raw dump lands, you usually want to transform it, add schema, and make it queryable. Delta Lake 2.4 gives you ACID transactions on top of the same object store, turning a data lake into a mini‑warehouse. For keyword search across millions of pages, Elasticsearch 8.12 provides near‑real‑time full‑text indexing.
Pro Tip
Enable bucket versioning. It lets you roll back accidental overwrites and keeps a history for compliance.
Warning
Never leave your S3 bucket public. A single mis‑configured ACL can expose the entire crawl.
Deep Dive Architecture
Object storage offers cheap, immutable write‑once objects. Consistency is eventual for overwrite operations, so design your pipeline to write new keys instead of mutating existing ones.
Delta Lake stores transaction logs in _delta_log. Those logs give you snapshot isolation, time travel, and schema evolution without a separate database.
Elasticsearch shards split the index across nodes. Keep shard count aligned with expected document volume; too few shards cause hot spots, too many waste RAM.
Pros
- +Object storage is virtually unlimited and low cost
- +Delta Lake adds ACID guarantees without moving data
- +Elasticsearch provides sub‑second full‑text queries
- +All three services are managed, so you focus on code
Cons
- —S3 eventual consistency can surprise overwrite logic
- —Delta Lake requires a compute engine (Spark, Flink) to write
- —Elasticsearch clusters need careful heap sizing
- —Cross‑region data transfer adds latency and cost
Real-World Engineering Examples
- A nightly crawl writes raw pages to s3://my‑crawl‑bucket/raw/YYYY/MM/DD/. A Spark job reads the bucket, parses out meta tags, and writes a Delta table at s3://my‑crawl‑bucket/delta/pages. The table is then queried with SQL for analytics.
- A Lambda function extracts the page title and body, then posts a JSON document to Elasticsearch via the _bulk API. The document includes a "crawl_id" field that points back to the original S3 object.
Pro Tip
Pick the right tool for each stage: cheap object storage for raw dumps, Delta Lake for reliable transforms, Elasticsearch for lightning‑fast search.
Deduplication, Politeness, and Robots.txt Compliance
When you spin up a crawler, the first thing you need to stop the spider from looping over the same page over and over is a solid deduplication step. Crawler‑commons 1.4 gives you a battle‑tested URLCanonicalizer that normalizes scheme, host case, default ports, and path segments in one shot.
Politeness isn’t a nice‑to‑have, it’s a must‑have. The library also ships a simple robots.txt parser that extracts crawl‑delay and disallowed paths, so you can throttle yourself without building a scheduler from scratch.
Pro Tip
Cache the parsed SimpleRobotRules per host; it saves a network round‑trip on every request.
Warning
Don’t rely on the parser’s default user‑agent string – always pass your own identifier, otherwise you’ll get the generic rules which may be overly restrictive.
Deep Dive Architecture
URLCanonicalizer strips fragments, resolves ".." segments, and lower‑cases the host. The output is a deterministic string you can safely hash and store in a Bloom filter or a Redis set for fast duplicate checks.
SimpleRobotRulesParser reads the raw robots.txt bytes, respects the User‑Agent section you specify, and returns a SimpleRobotRules object. From that object you get isAllowed(url) and getCrawlDelay(), which you can feed into a Thread.sleep or a token‑bucket limiter.
Pros
- +Proven, open‑source implementation that handles edge‑cases like IPv6 hosts and percent‑encoding
- +Integrates directly with other crawler‑commons utilities, keeping the stack small
Cons
- —Adds an extra Maven/Gradle dependency to your build
- —Version 1.4 lacks support for the newer "Crawl‑Delay" syntax introduced in RFC 9309
Real-World Engineering Examples
- In a news‑site scraper we fetched https://example.com/robots.txt once, parsed it with SimpleRobotRulesParser, and then filtered every candidate URL through rules.isAllowed(canonicalUrl) before queuing it.
- Our URL deduplication pipeline stores the SHA‑256 of URLCanonicalizer.getCanonicalURL(url) in a PostgreSQL table. Before a fetch we check for existence; if the hash is present we skip the request entirely.
Pro Tip
A small, battle‑tested library removes the guesswork from deduplication and politeness, letting you focus on the actual data you want to extract.
Observability, Monitoring, and Quality Assurance
Running a distributed web crawler means you have dozens of workers, a scheduler, and a result store all talking over HTTP. If one node stalls, the whole pipeline backs up. The first step is to make that failure visible before it hurts your SLA. Metrics, traces, and alerts give you a live health check and a forensic trail when things go south.
Prometheus 2.53, Grafana 10.2, and OpenTelemetry work together like a three‑piece band. Prometheus pulls numeric data from each component, OpenTelemetry injects trace IDs into every request, and Grafana visualises both streams in a single pane. The stack is lightweight, open‑source, and integrates with Kubernetes out of the box, so you can spin it up alongside your crawl pods without a separate ops team.
Pro Tip
Expose a /metrics endpoint on every worker and let Prometheus scrape it on a 15‑second interval. The lower the scrape interval, the faster you spot spikes, but balance it against scrape overhead.
Warning
Never expose Prometheus’s admin UI to the public internet. It can reveal internal metrics and be a foothold for attackers.
Deep Dive Architecture
Prometheus uses a static scrape config or a ServiceMonitor if you run the Prometheus Operator. Define a job named "crawler" that pulls HTTP request latency, queue depth, and error counters from each pod’s /metrics endpoint. Store the metrics in a 15‑day retention bucket; older data can be down‑sampled for cost savings.
Grafana dashboards pull from Prometheus and can also ingest OpenTelemetry traces via the Tempo data source. Build a panel that overlays request latency (a Prometheus query) with trace error rates (a Tempo query) so you see latency spikes and their root cause in a single view.
Pros
- +Native Prometheus metrics are low‑overhead and integrate with Kubernetes out of the box
- +Grafana offers a rich UI for both metrics and traces
- +OpenTelemetry provides language‑agnostic instrumentation
Cons
- —Managing three separate components adds operational complexity
- —Prometheus scrape latency can miss very short bursts
- —OpenTelemetry SDKs need to be added to each language runtime
Real-World Engineering Examples
- A Kubernetes manifest adds an annotation prometheus.io/scrape: "true" to every crawler pod. Prometheus then automatically discovers the pods via the Kubernetes service discovery mechanism and starts pulling metrics.
- An OpenTelemetry Collector configuration routes all span data from the crawler SDK to a local Tempo instance, then forwards a copy to a remote Jaeger endpoint for long‑term storage.
Pro Tip
Hook metrics, traces, and alerts together early; the visibility you gain pays for the extra components in the long run.
Emerging Trends and Future Directions
Serverless platforms let you scale crawlers without a fleet of VMs. Cloudflare Workers run at the edge, so a fetch call hits the target from the nearest PoP. A typical worker pulls the page, strips scripts with DOMParser, and writes the raw text to a KV namespace. Because Workers have a 50 ms CPU budget, you keep the logic tiny and let the KV store handle durability. Compare that with an AWS Lambda that needs an S3 bucket for temporary storage and a VPC for outbound traffic; the latency and cold‑start cost are higher. Privacy laws are catching up. GDPR’s Article 5 forces you to delete personal data on request, and CCPA requires clear opt‑out mechanisms. A good practice is to tag every extracted field with a provenance flag and purge KV entries after 30 days. Ignoring these rules can shut down your crawler pipeline overnight.
Pro Tip
Cache LLM responses for identical URLs to cut cost and latency.
Warning
Watch for token limits on LLM calls; truncate HTML before sending it to the model.
Deep Dive Architecture
Choosing the right model matters. DistilBERT is fast and cheap for entity tagging, while GPT‑4o‑mini shines at abstractive summarization. Pair them in a pipeline to balance speed and quality.
Edge execution constraints require you to keep code under 1 MB and stay within the 50 ms CPU window. Offload heavy work to a downstream API if you hit the limit.
Pros
- +Reduces parser maintenance across changing sites
- +Low latency thanks to edge execution
Cons
- —LLM API cost can add up quickly
- —Worker CPU budget limits processing complexity
Real-World Engineering Examples
- A news aggregator uses the OpenAI API to extract headlines and generate a three‑sentence summary for each article before storing it in a Cloudflare KV store.
- An e‑commerce price monitor runs a Cloudflare Worker every 5 minutes, fetches product pages, strips HTML, and writes the cleaned price data to KV for a downstream analytics job.
Pro Tip
Edge crawling plus LLM extraction gives you speed and flexibility, but you must budget for API costs and stay compliant with privacy rules.
Frequently Asked Questions
What is a web crawler in the context of data engineering?
How do you ensure scalability when building crawling pipelines?
What are common pitfalls when integrating crawlers with data lakes?
Conclusion & Next Steps
Modern data engineering treats web crawlers not as rogue bots but as disciplined data sources, embedding them within end‑to‑end pipelines that begin with URL discovery and end with enriched, query‑ready assets in a data lake or warehouse.
By leveraging distributed processing engines, containerized micro‑services, and event‑driven architectures, engineers can scale crawling workloads to billions of pages, maintain fault tolerance, and dynamically adjust crawl intensity based on real‑time business signals.
Mastering the art of the ‘creepy crawlies’ empowers organizations to harvest fresh web‑scale information at speed, turning noisy raw HTML into actionable intelligence while upholding compliance, quality, and cost efficiency.
TechPulse
Verified AuthorPrincipal Cloud Architect & AI Systems Engineer
Official editorial team and architectural research division at TechPulse, covering scalable web engineering, autonomous AI systems, and cloud infrastructure.
Stay Ahead of the Curve
Get our weekly digest of production blueprints, deep-dive benchmarks, and architectural audits delivered directly to your inbox.
Join 5,000+ engineers. No spam, ever.
You might also like
More deep dives for modern engineers.

Exploring GPT-6.1 SOL: Architecture, Capabilities, and Real-World Applications

Why the Boeing 787‑9 Dreamliner Was Diverted to LAX: Technical Causes & Operational Impact
